Hewlett-Packard · Production Monitoring software · 2021–2023
Live production
project impact
+1 user segment
First HP solution purpose-built for Production Managers, addressing fleets of 3–15 printers operating simultaneously.
-16%
Reduction in usability-related tickets after the redesign shipped
+19%
Usage increase in the product after redesign

Client
Hewlett-Packard
Team size
1 Lead engineer · 1 Product Manager
2 Front end devs · 2 Back end devs
My role
UI/UX/Visual Designer
Temporary Project Manager
tools
Figma · Jira

phase 00
Context & challenge
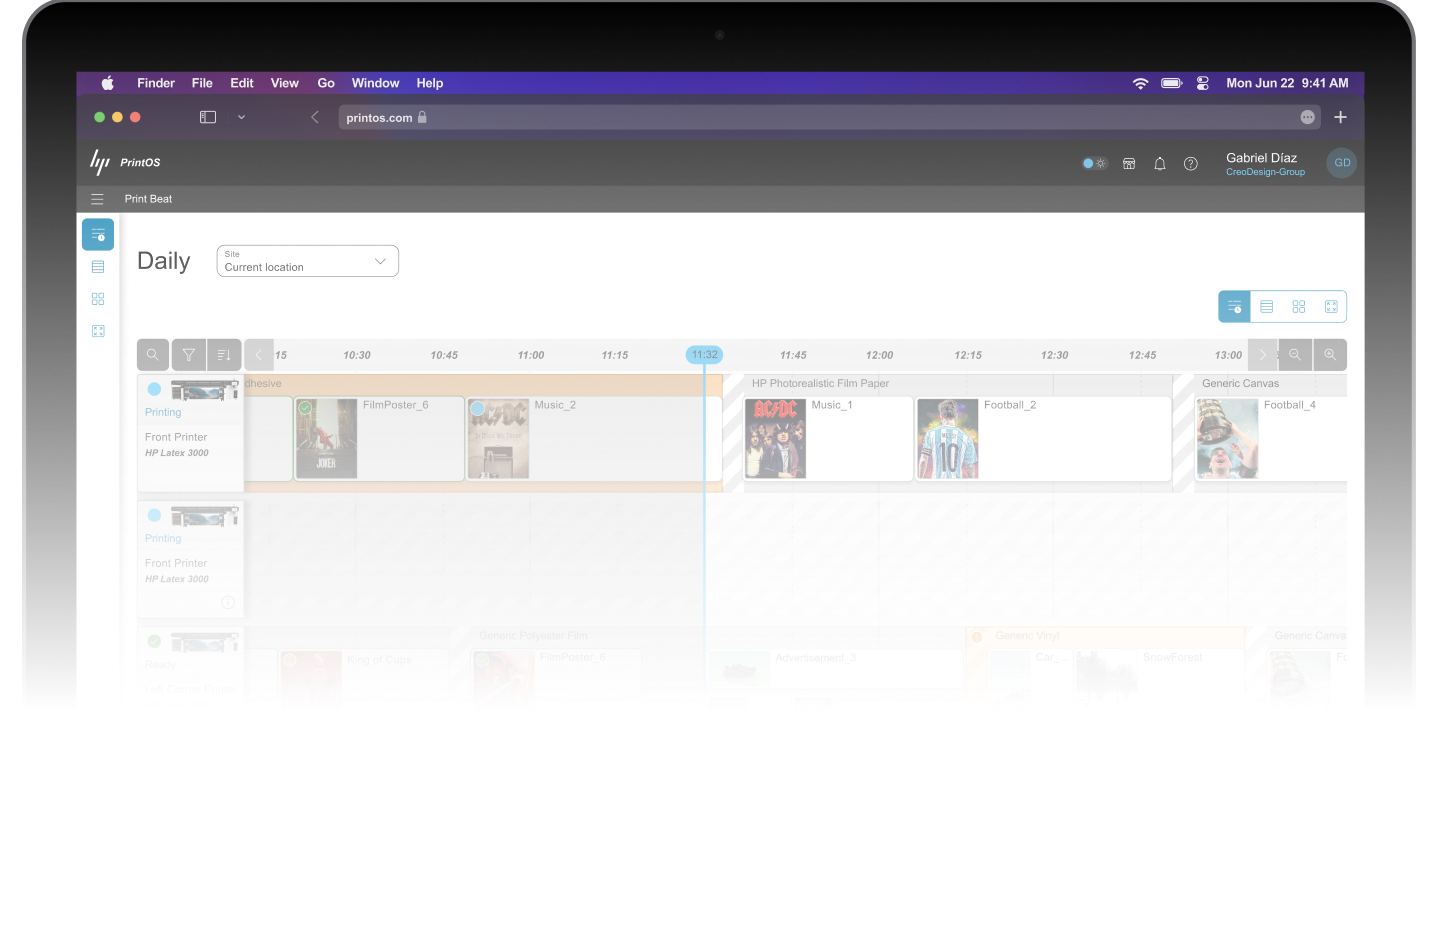
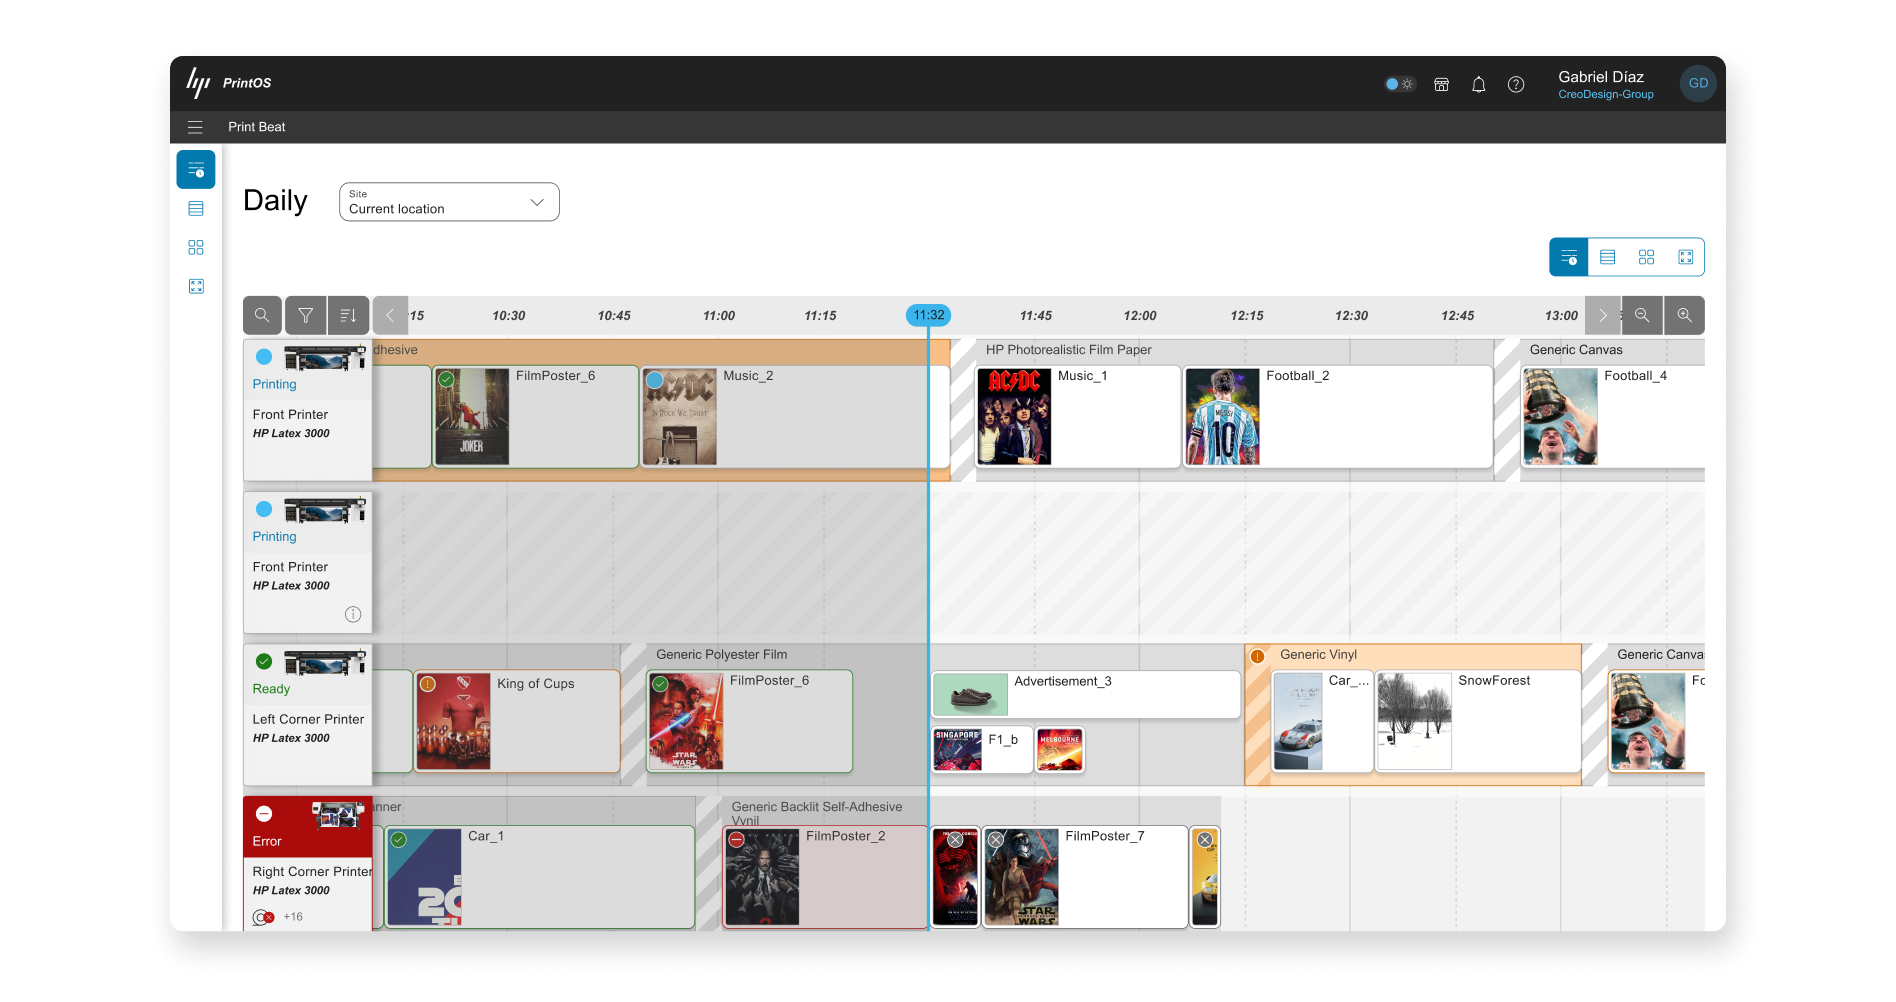
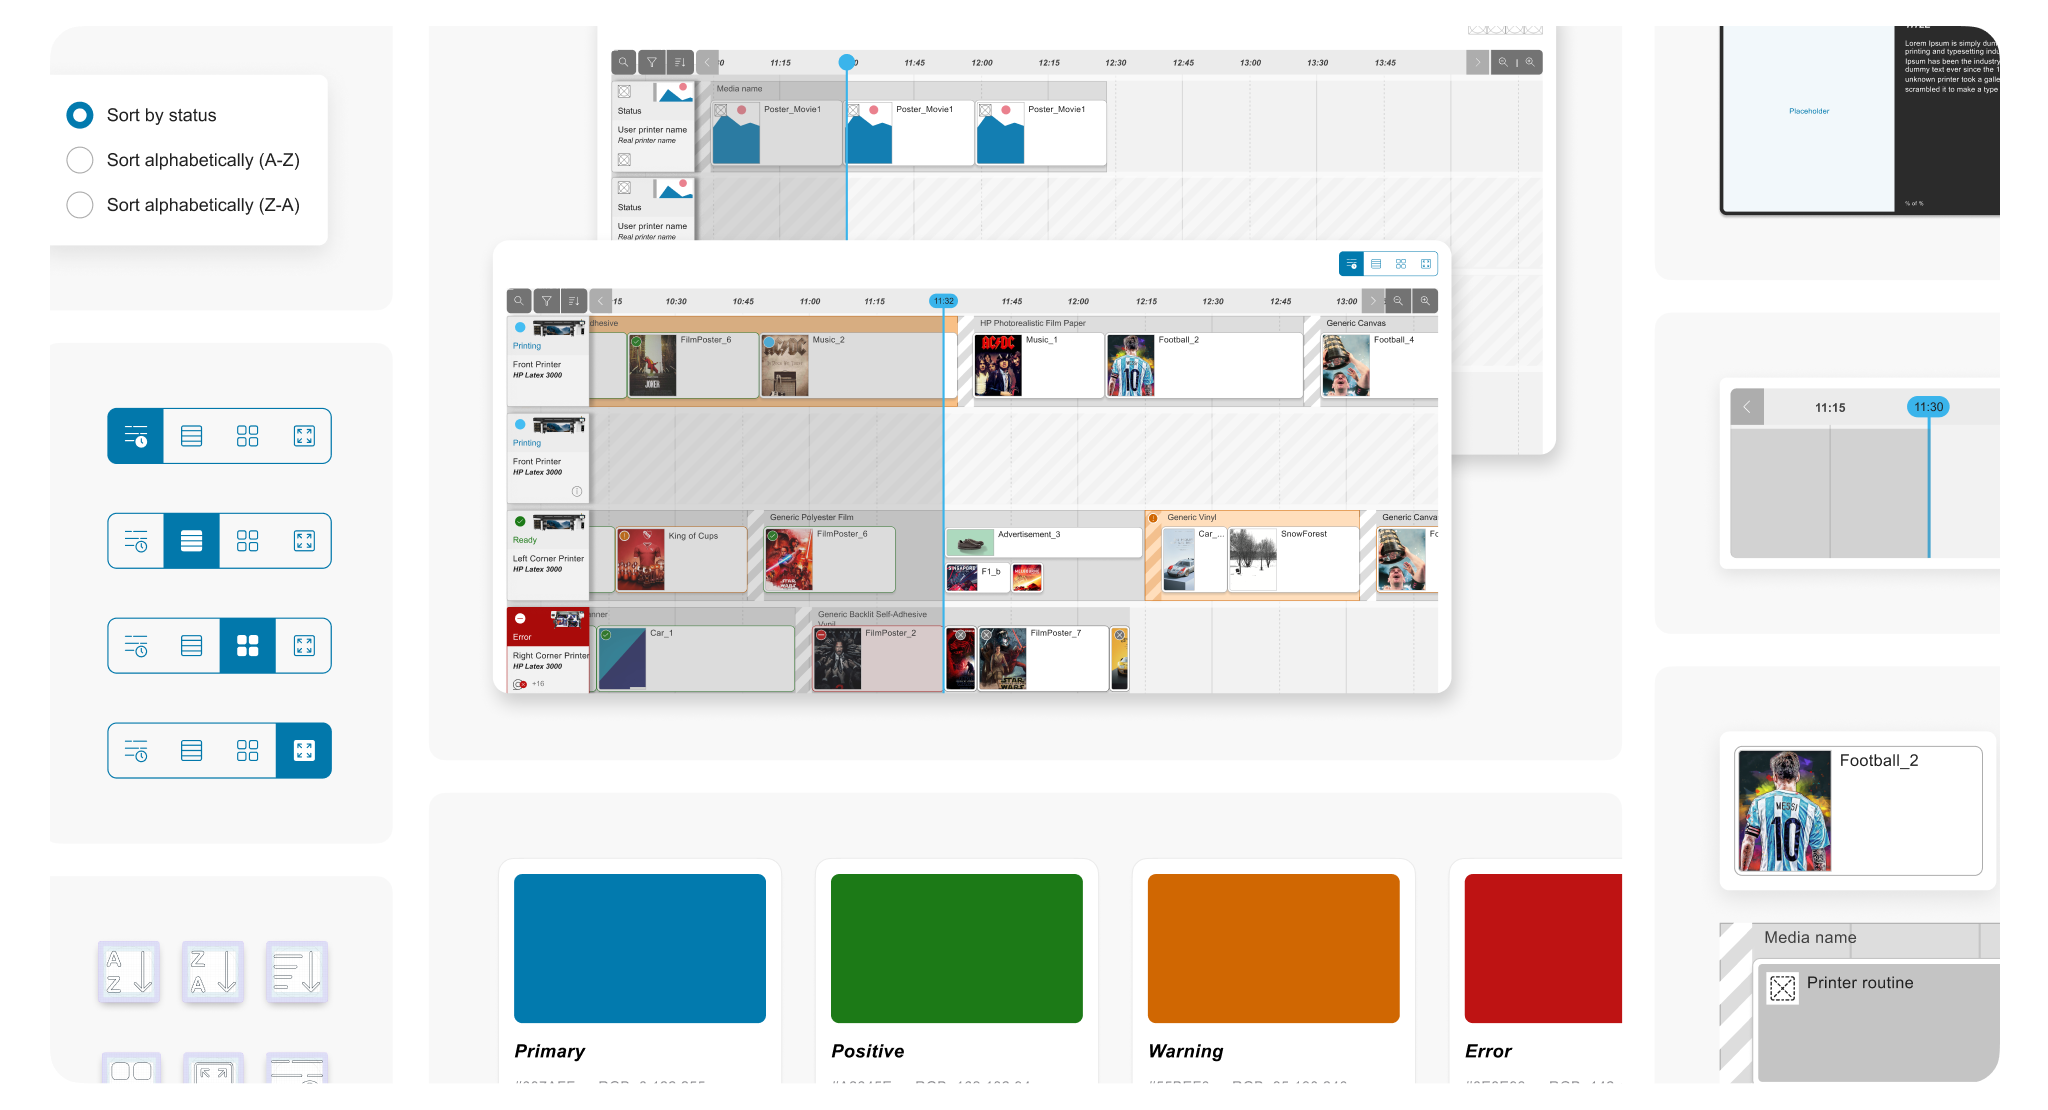
Live Production is a web-based monitoring tool built for the printing industry, designed to give companies running fleets of 3 to 15 printers better visibility and control over their production. While the primary audience is Production Managers, the tool is also useful to operators and other team members who need to know what’s happening across the floor.
The project’s core goals were to give Production Managers real-time visibility into overall production, help them spot production gaps they could act on, provide quality controls, and surface instant status updates for individual printers.
“How might we give Production Managers a clear, real-time view of their printer fleet’s status, with the tools to spot and act on production gaps as they happen?”
Phase 01
Research & Discovery
The product was built from the ground up, with a team made up of 1 Project Manager, 3 developers, 1 Customer Experience Lead, and myself as UI/UX/Visual Designer, working in an agile setup from day one.
In the first phase, the CX Lead and I ran roughly four rounds of in-depth user interviews, supported by the research team, to understand what Production Managers actually needed day to day. A few things came out clearly:
Insight 1: Managers needed an at-a-glance view of past, current, and future production — with no extra effort to get there. Anything that required digging around was already part of the problem.
Insight 2: Every minute a printer sat idle cost the business money, so spotting production gaps and delays early — not after the fact — was the priority.
Insight 3: Coordination was entirely manual. Managers walked the production floor to check on operators and machines, and because priorities and projects shifted constantly, replanning meant pulling everyone into meetings to reorganize work from scratch.
From there, we built personas and mapped the customer journey to pin down where these frictions hit hardest, which shaped the MVP scope: real-time fleet visibility, gap/delay detection, quality control tooling, and per-printer status — signed off by the business as the initial roadmap.
Phase 02
Ideation & validation
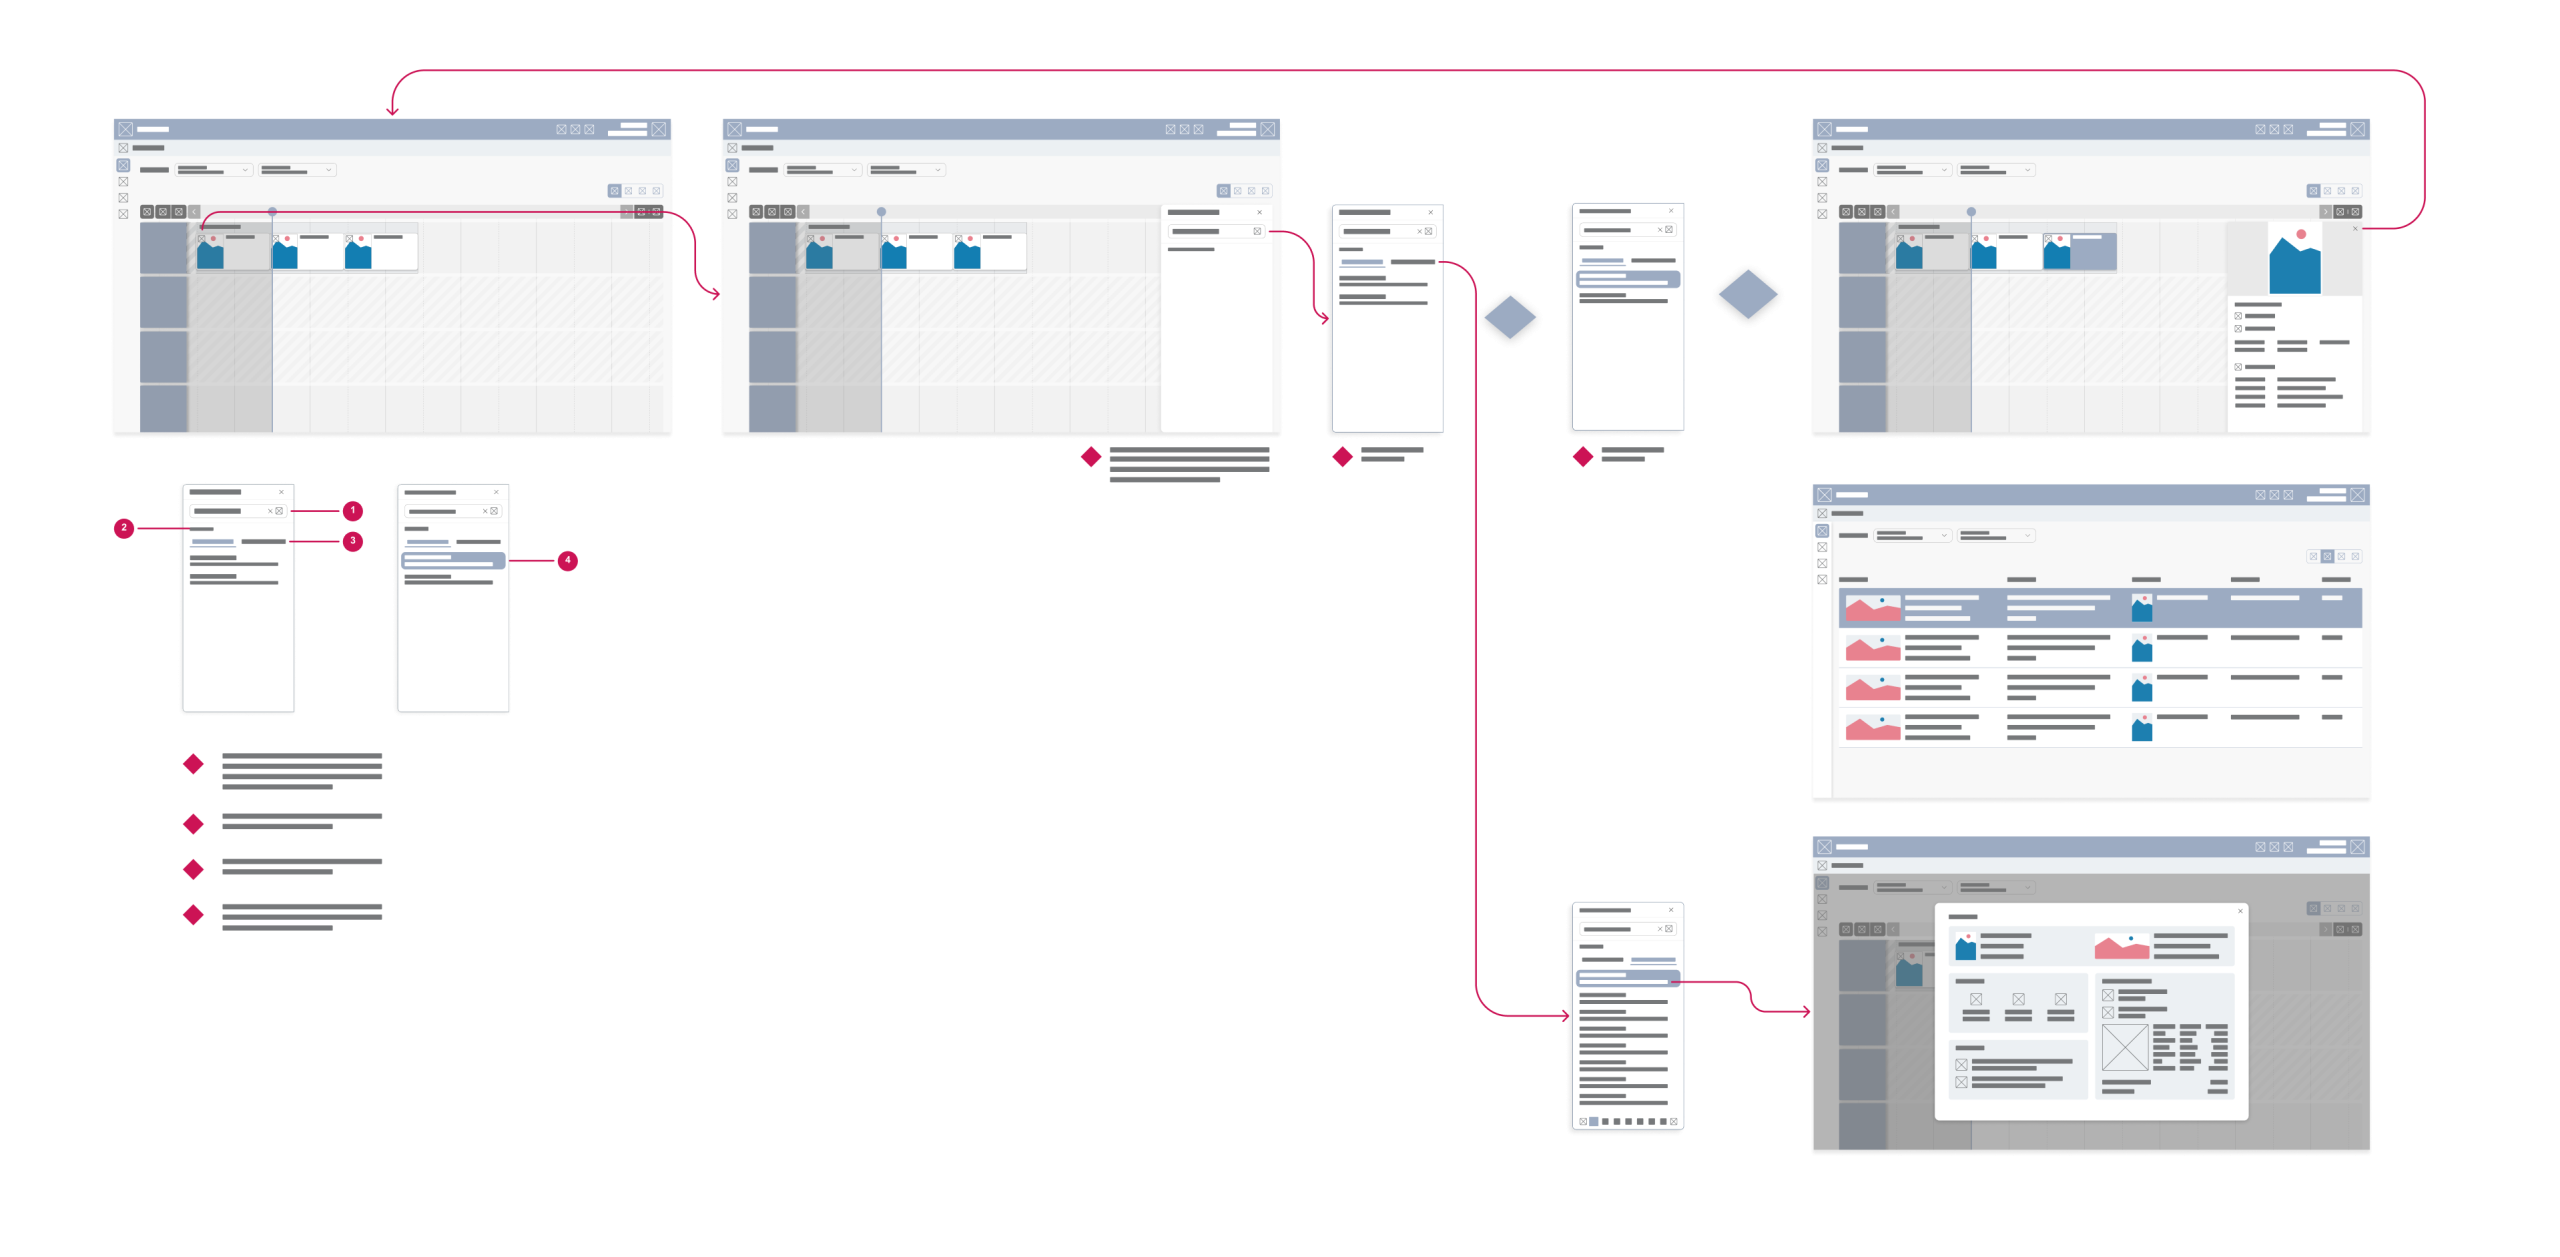
With the MVP scope defined, low-fidelity wireframes evolved into high-fidelity layouts and flow alternatives, tested with real users — including Production Managers working with a functional prototype, and sessions mixing qualitative feedback with more targeted questions about specific UI choices.
Hypothesis Tested
A single consolidated view of past, current, and future production status would reduce managers’ need to walk the floor or call ad-hoc replanning meetings.
WHAT WE LEARNED
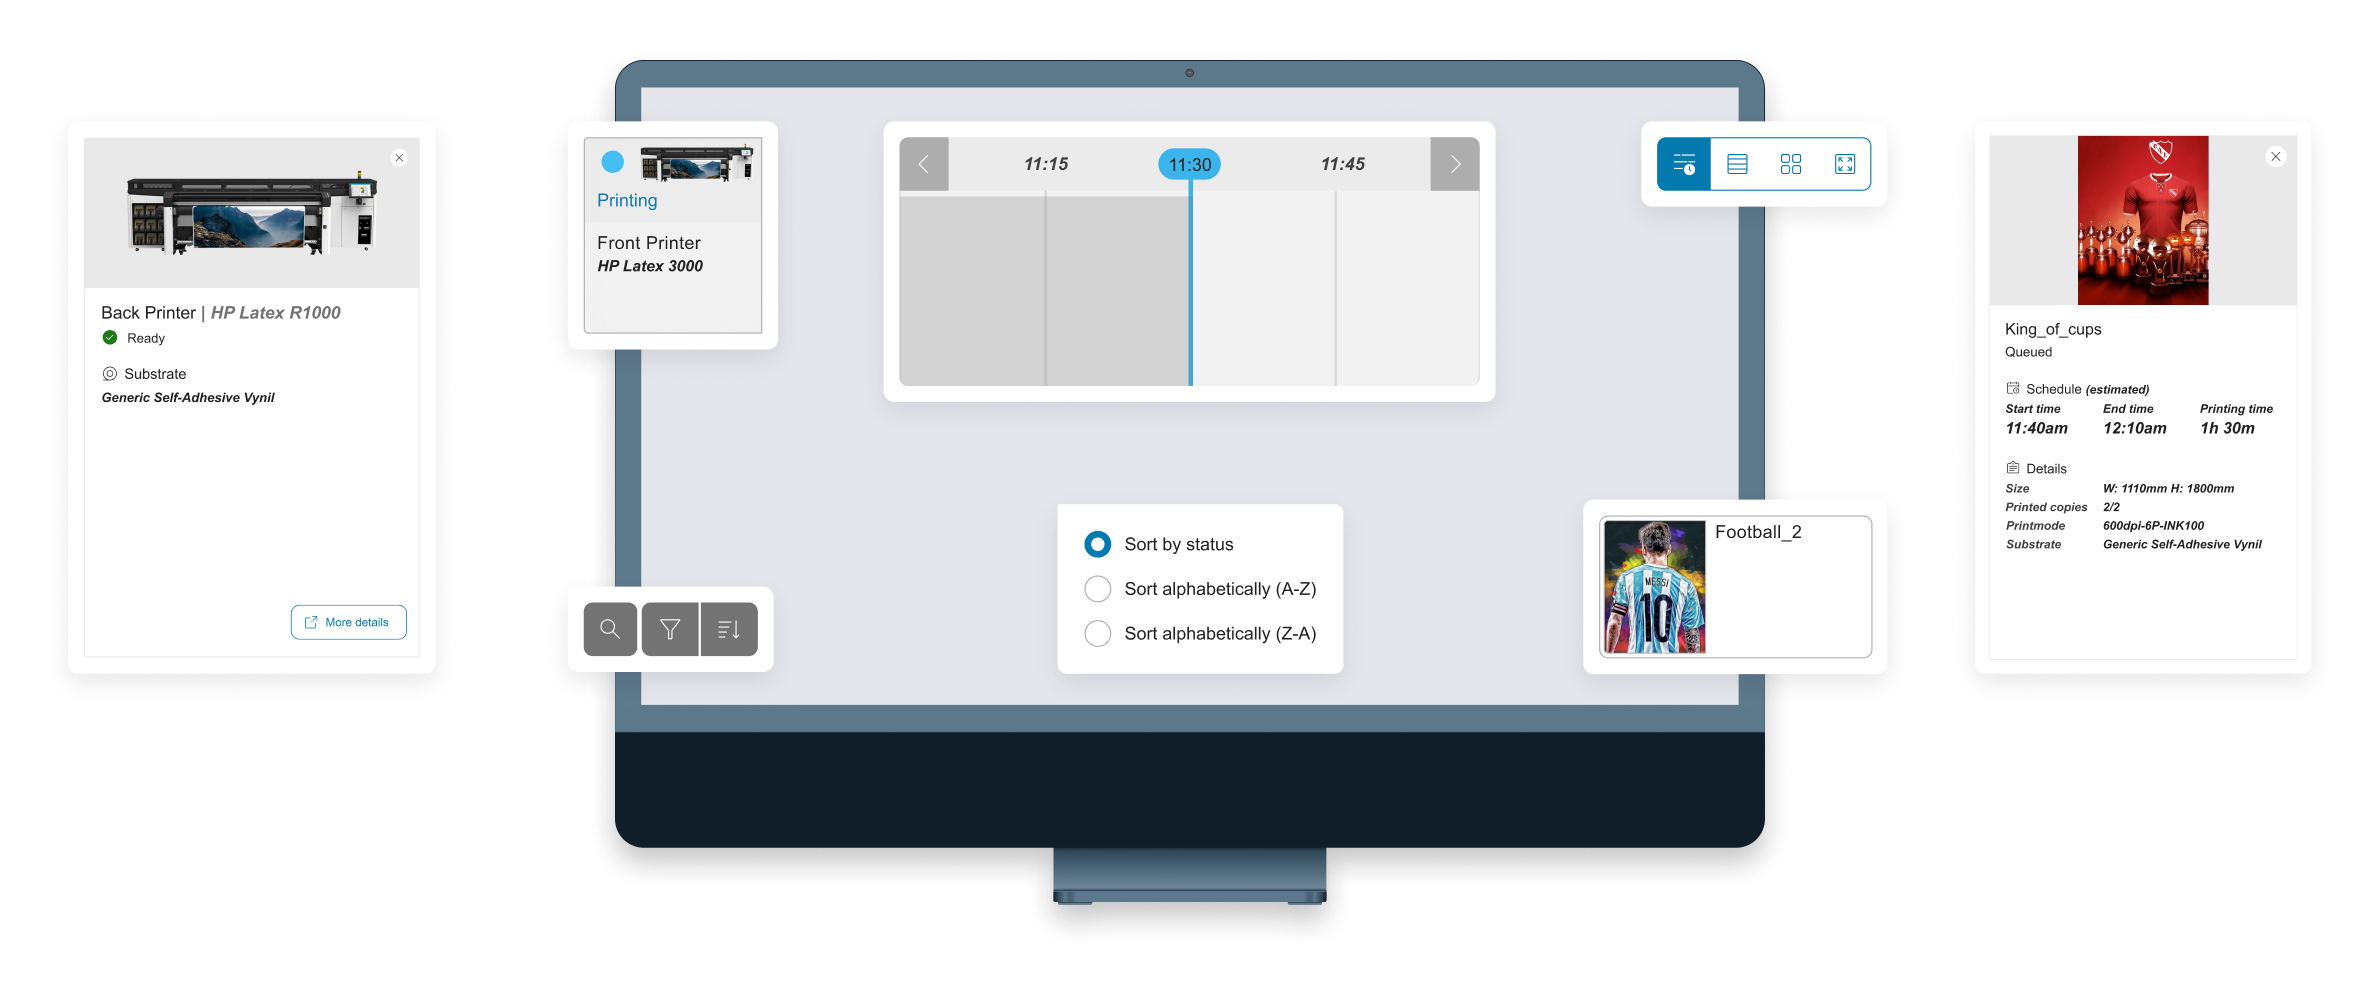
Visibility alone wasn’t enough — once a gap was visible, managers needed to act on it fast. That’s where job search and filtering came in: letting them locate and reprioritize specific jobs directly from the same view, rather than just confirming a problem existed.
Phase 03
UI Definition & Solution
From here, I moved into producing interaction and visual specs for the development team, and built out components for the shared design library used across multiple solution teams — including custom icons created specifically for this product. I also created standalone prototypes for the IT and QA teams to use for validation as the build progressed.
This phase also marked the project scaling up significantly: development teams in India, Israel, and the US joined, which meant the specs and design system components needed to be clear and self-explanatory enough to support handoff across multiple time zones and teams without constant clarification.

Conclusions
Project analysis
Outcome
All HP software solutions live within a single shared platform, so before MVP testing could begin, I redesigned that platform to integrate Live Production in a way that matched how users actually navigated — translating their mental model into the platform’s information architecture. Over time, this expanded into a broader design ownership role across the platform itself. After integration, the product went through several months of beta testing, with further interview rounds used to refine it ahead of market launch. Shortly after launch — and before moving to a new project — I took on the Project Manager role as well, covering stakeholder meetings, requirements definition, spec work, and early-stage ideation for the project’s second phase.
Retrospective
This was the project where I learned the most about end-to-end ownership. I was responsible for the whole 0-to-1 process — starting with research to figure out what users actually needed, and whether there was something worth building at all, including validating that people would pay for it. From there, I shaped those findings into early concepts, prototyped, and tested different directions with users. The team then built the product in waves to hit deadlines, using each round of testing to inform what came next. Balancing that research depth against delivery pressure, with a team that grew across three continents, was the biggest growth area for me on this project.

