PVcase · Solar energy production · 2025–2026
Yield
project impact
20%
Of simulations now run utility-scale setups utilizing MV and HV transformers
-68%
Drop in support tickets related to the new features
+19%
Usage increase in the product after redesign

Client
PVcase
Team size
1 Lead engineer · 1 Product Manager
3 Front end devs · 3 Back end devs
3 Energy scientifics
My role
Senior Product Designer & UX Researcher
tools
Figma · Claude AI · Gemini AI · Dovetail · Jira

Phase 00
Context & challenge
PVcase Yield is a solar energy simulation platform used by engineers, project developers and financiers to model the energy output of photovoltaic plants — numbers that go straight into financial models, investor presentations and engineering sign-offs. Accuracy and clarity aren’t nice-to-haves here; they’re the product.
I joined as the Senior Product Designer embedded in a cross-functional squad of 11 — a PM, a lead engineer, three frontend developers, three backend developers and three energy scientists, based in Lithuania and Germany while I worked from Spain. As the platform’s simulation depth kept growing to cover more complex real-world scenarios — multi-technology plants, financial risk modeling, utility-scale electrical infrastructure — the interface needed to absorb that complexity without becoming harder to use or harder to trust.
“How might we introduce genuine technical complexity into an already dense simulation tool without compromising interface trust or operational clarity?”
Phase 01
Research & Discovery
The starting point was a review of recurring themes in customer support requests, paired with user interviews, to understand where the gap between the tool’s depth and its usability was widest. That process pointed to three areas worth investing in: how users interpret yield estimates, how accurately the tool modeled inverter behavior under heat, and how granular electrical loss modeling needed to be for utility-scale plants.
Insight 1: A single yield number (P50) wasn’t enough — users needed a probability range to negotiate with banks and clients, and a way to put that range directly into the documents they share externally.
Insight 2 – The Data Misconception: The existing inverter model didn’t account for how high temperatures reduce output, a known gap versus industry-standard tools, flagged by the scientific team.
Insight 3: Users think of transformers as physical components — the same way they think of modules and inverters — not as an abstract “loss” setting. They needed independent control over MV and HV transformer and cabling losses, depending on their plant’s setup.
Phase 02
Ideation & validation
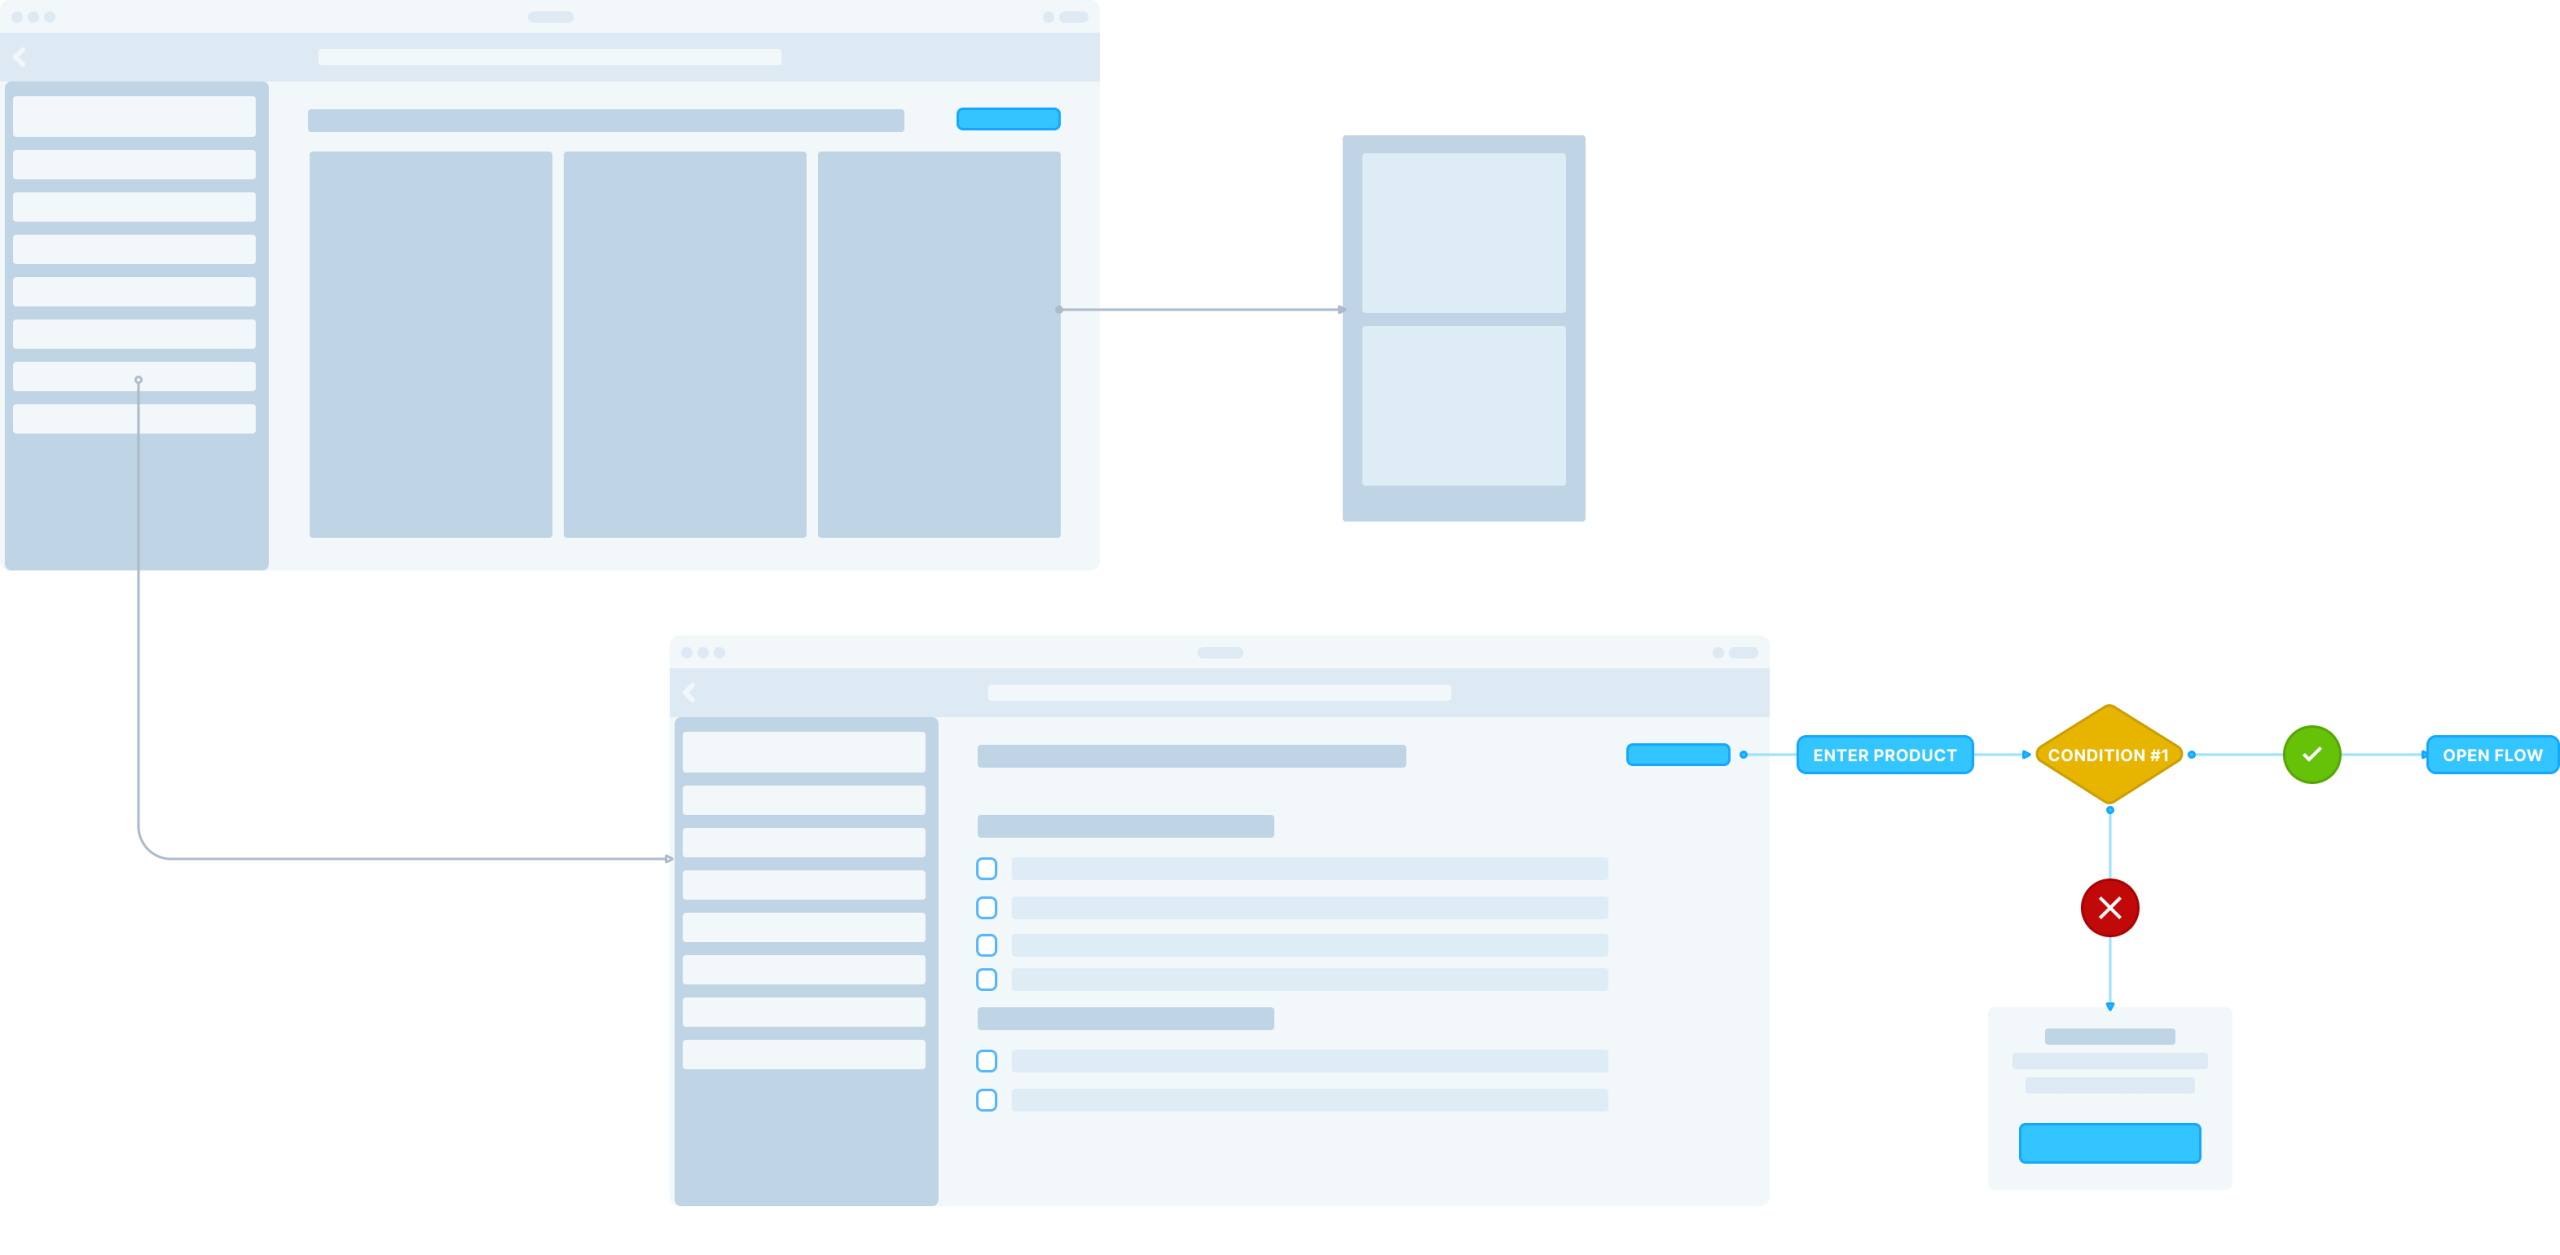
I mapped structural interaction layouts in Figma and paired qualitative research feedback with multi-variant wireframes to test how data density interacted with professional mental models.
Hypothesis Tested
If each new capability was introduced in a way that matched how users already think about their plants — components rather than abstract losses, ranges rather than single numbers, visual relationships rather than raw input fields — engineers would absorb real technical depth without the tool feeling more complex.
WHAT WE LEARNED
Early Claude prototypes, validated with users (using Dovetail to synthesize interviews and Gemini AI to explore structural directions), confirmed the overall approach — but each feature needed its own adjustment. MV/HV separation in particular required restructuring the information architecture, moving transformers out of the losses configuration entirely.
Phase 03
UI Definition & Solution
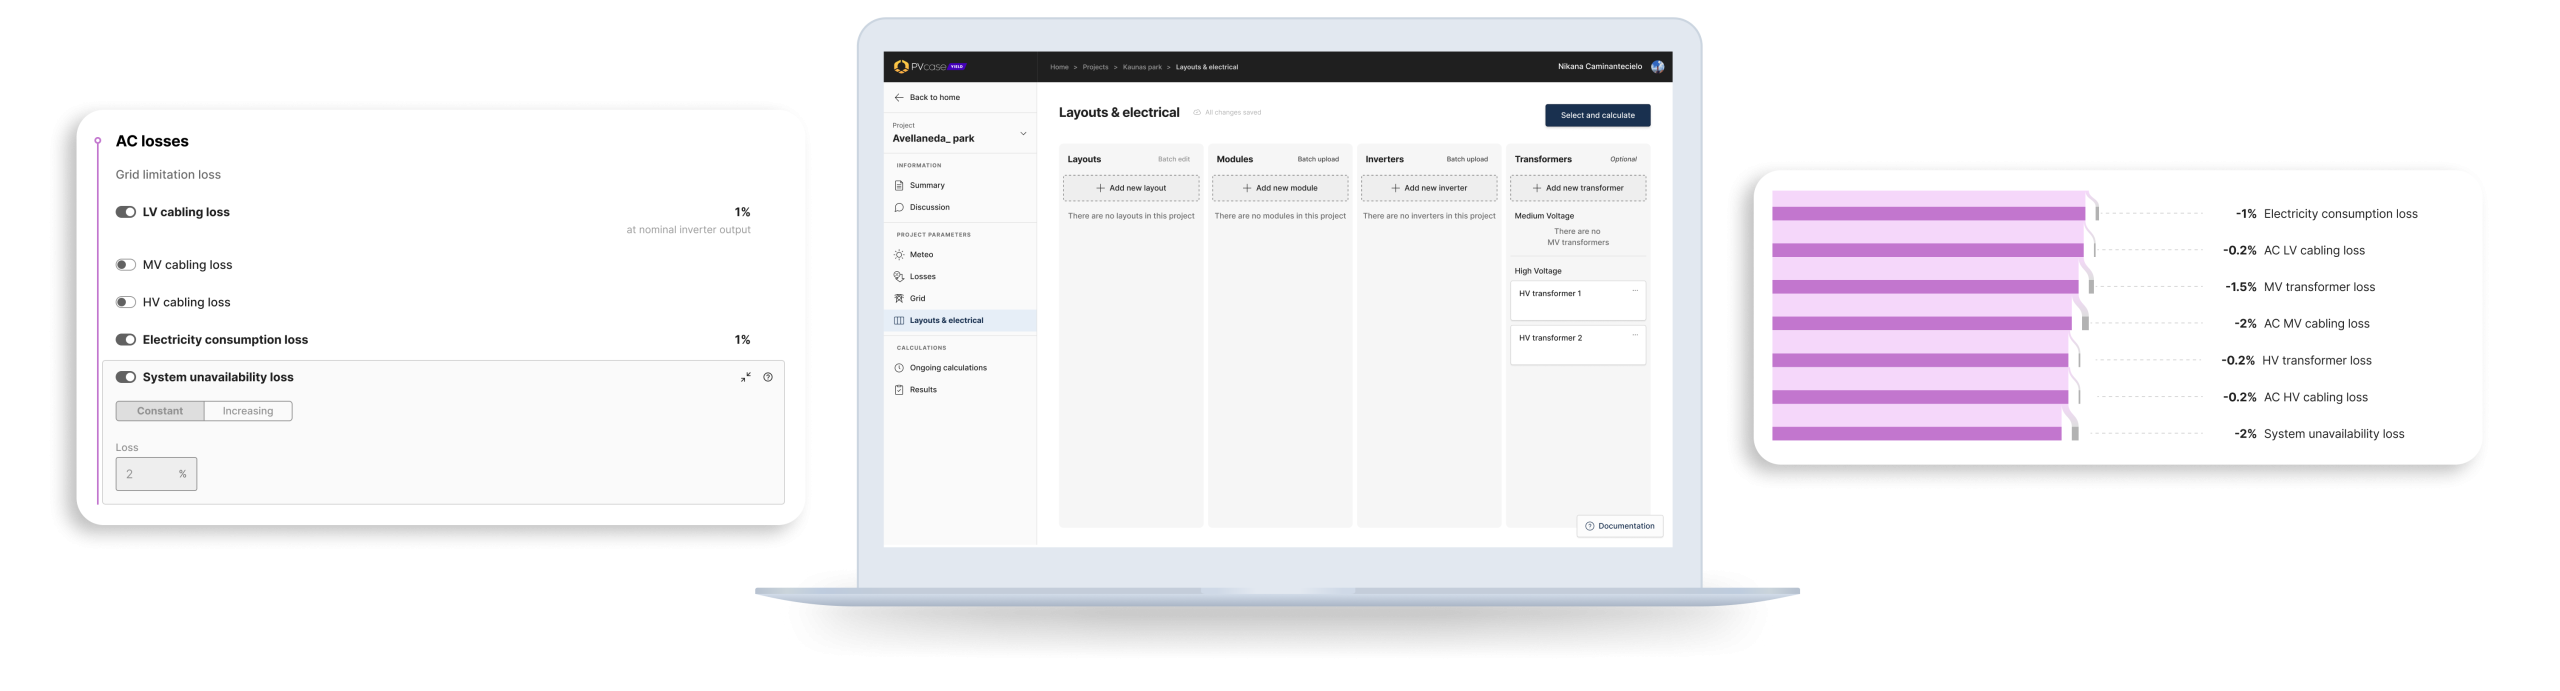
MV/HV Separation for AC Losses — This was the most structural change. Transformers moved out of the losses configuration and into the Layouts & Electrical page, alongside modules and inverters — where users expected to find them — with a new Transformers column holding independent MV and HV entries. The losses page was restructured so the former single AC cabling loss became LV cabling loss, with separate MV and HV categories below it, each toggleable depending on plant topology. Results, PDF and CSV/XLSX exports were all updated to reflect the new breakdown, and existing AC cabling loss values were preserved as LV cabling losses for backward compatibility.
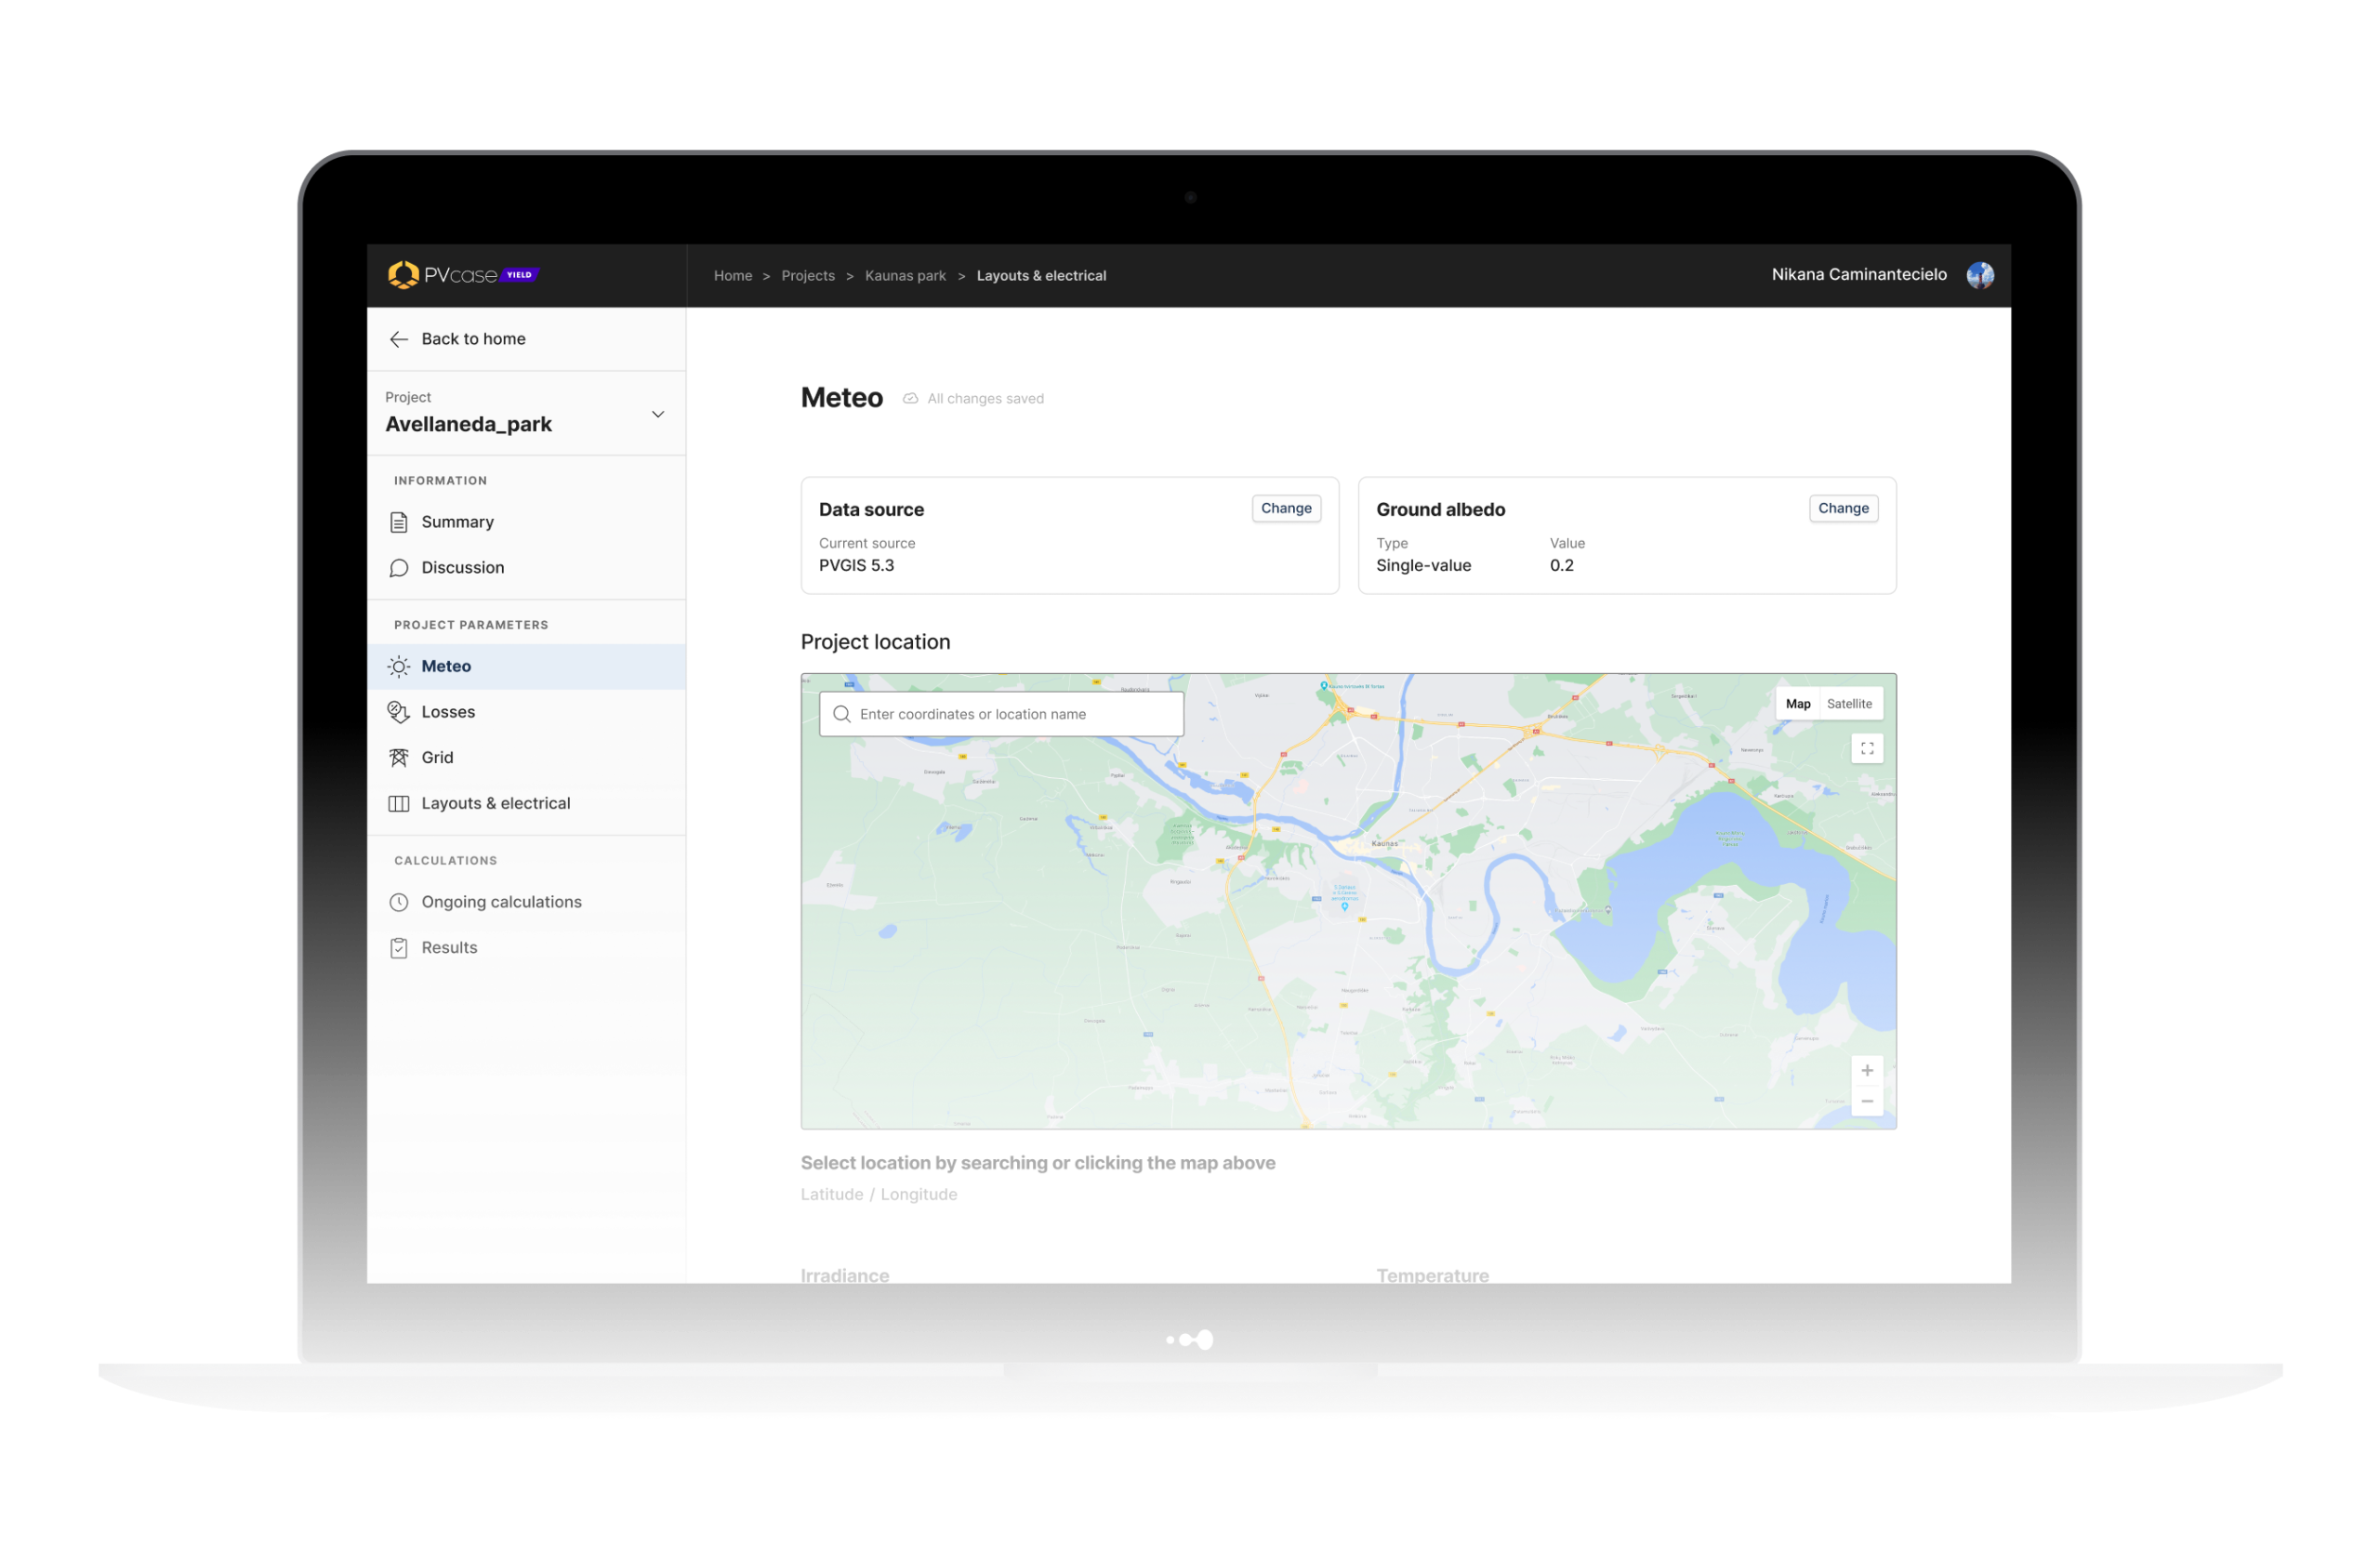
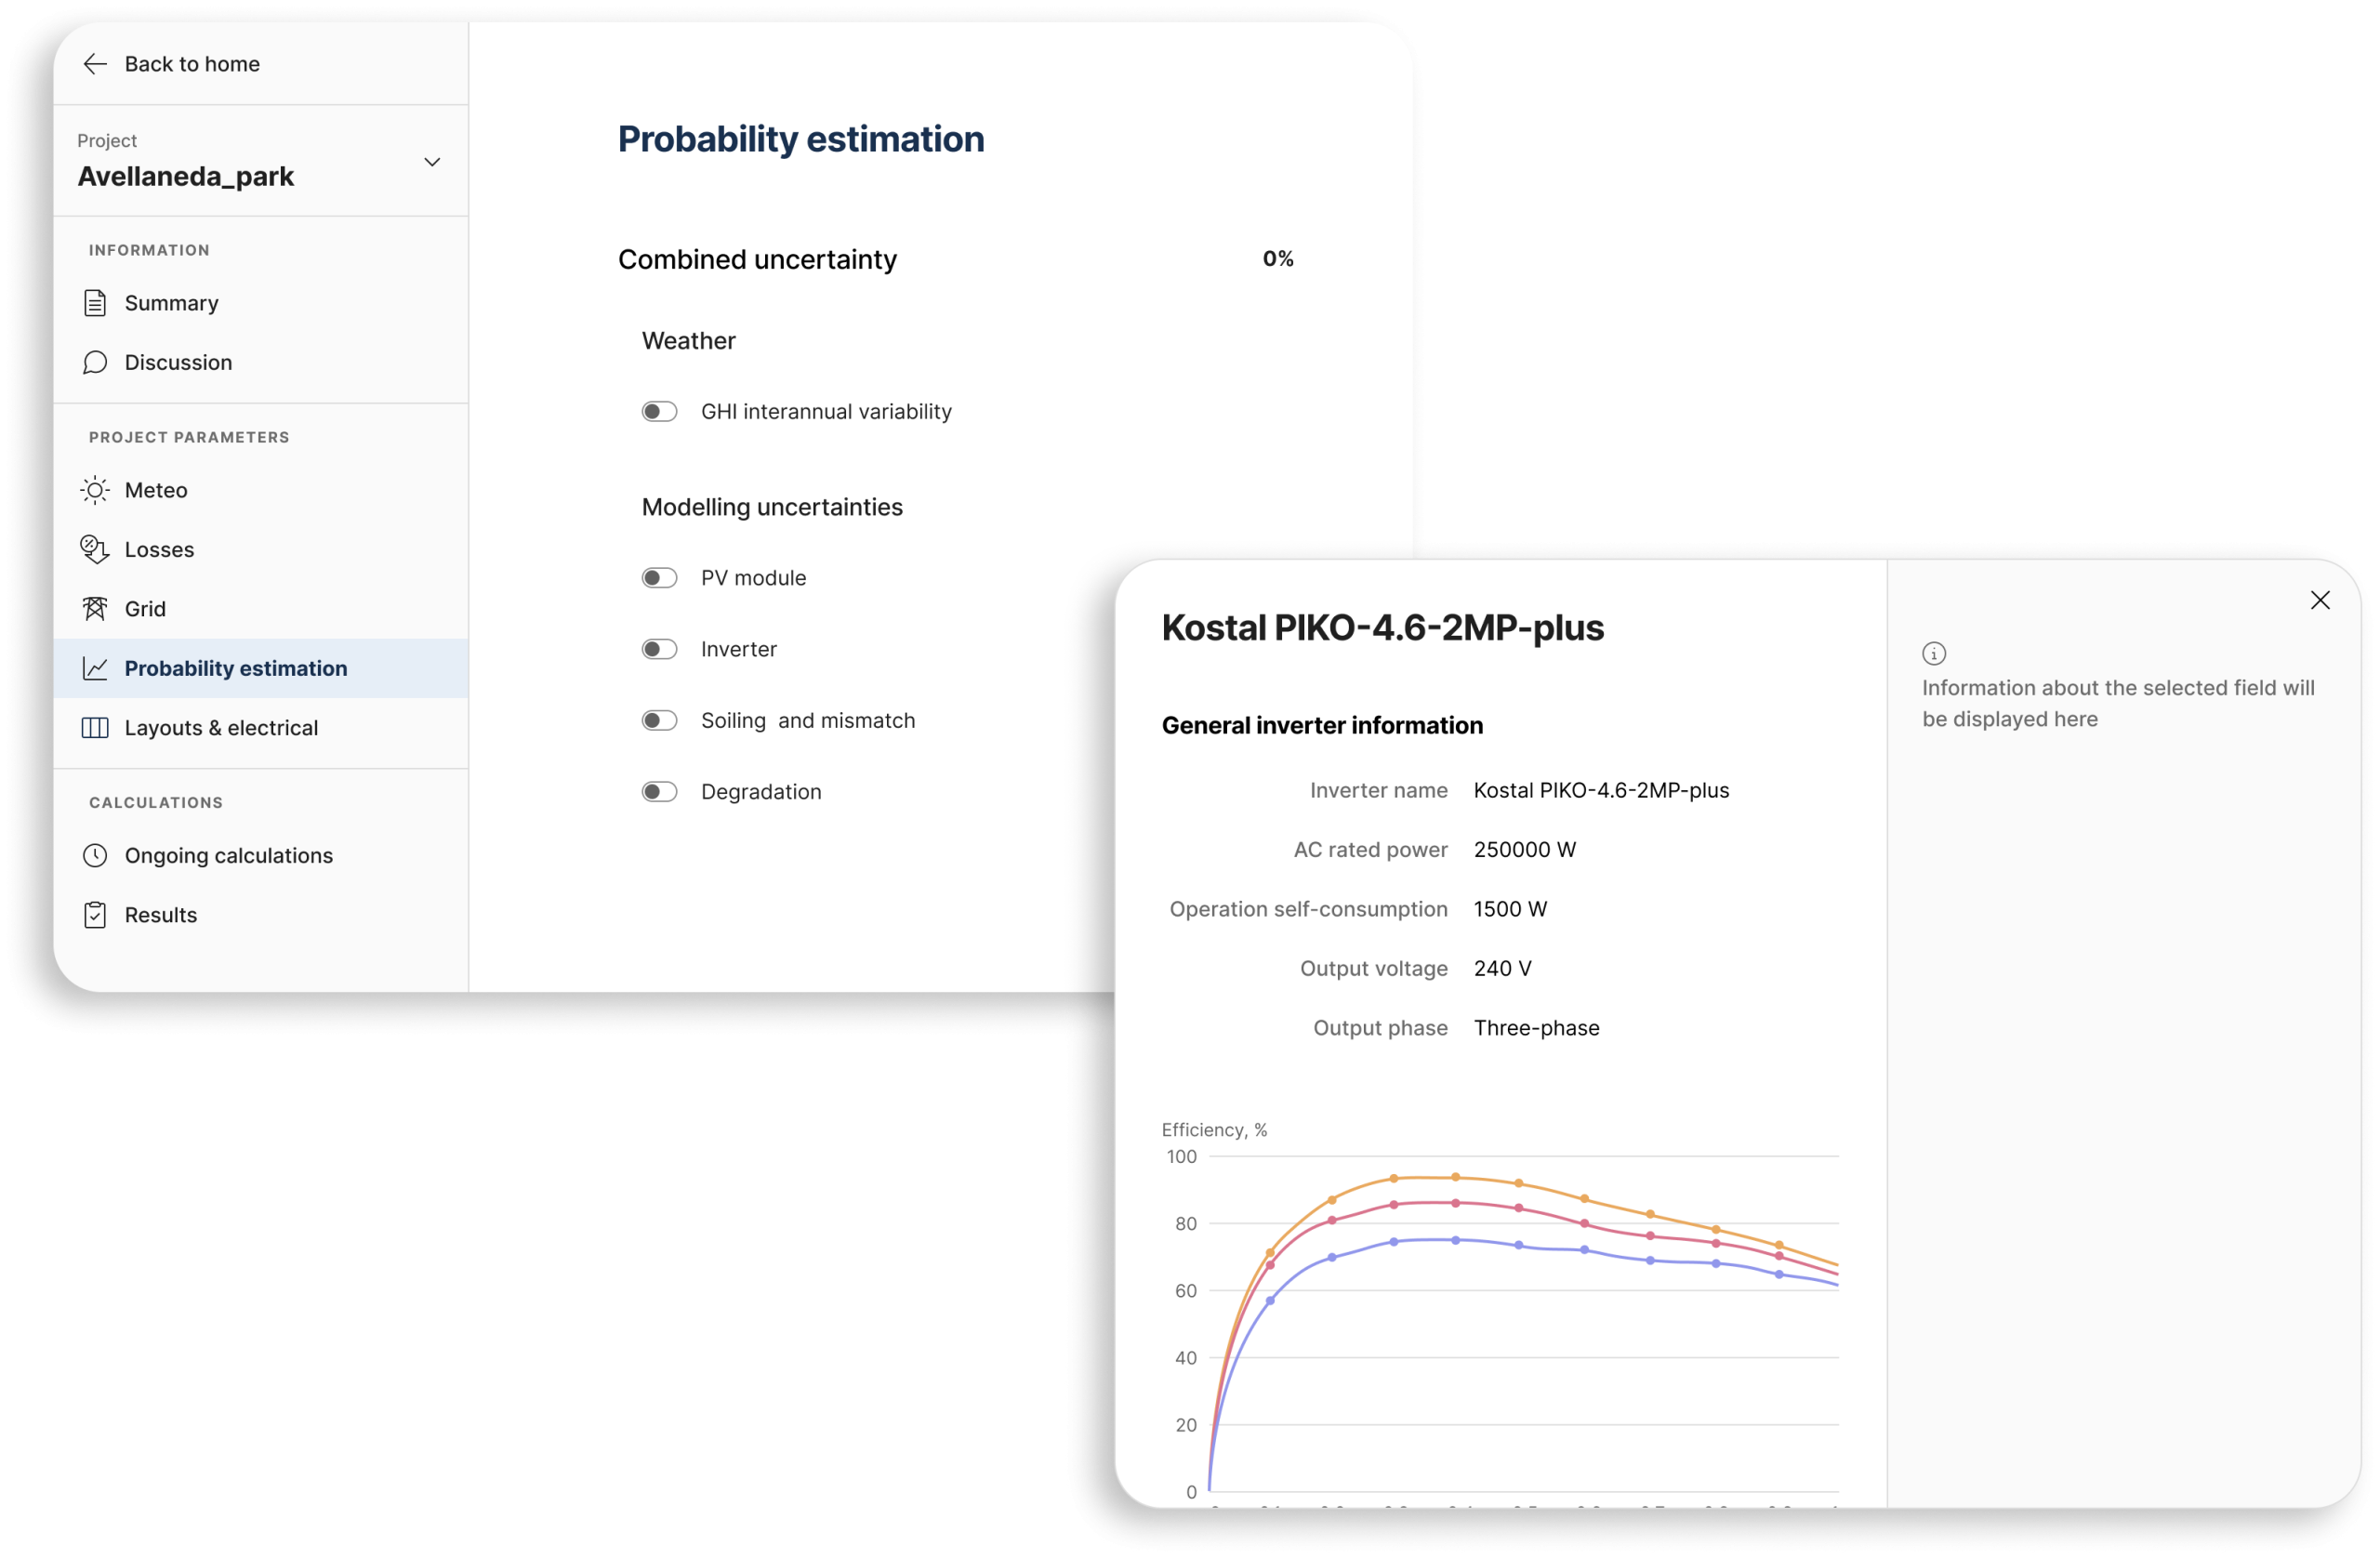
Probability Estimation — I introduced a dedicated “Weather Variability & Modeling Uncertainties” section, separate from the simulation inputs, to signal that this was about interpreting results rather than configuring them. Users can view the full P50–P99 range, with sensible defaults so less experienced users don’t need to configure anything manually. The output is readable at two levels: engineers can interrogate the full range for fine-tuning, while stakeholders can export the key values directly into the PDF report.
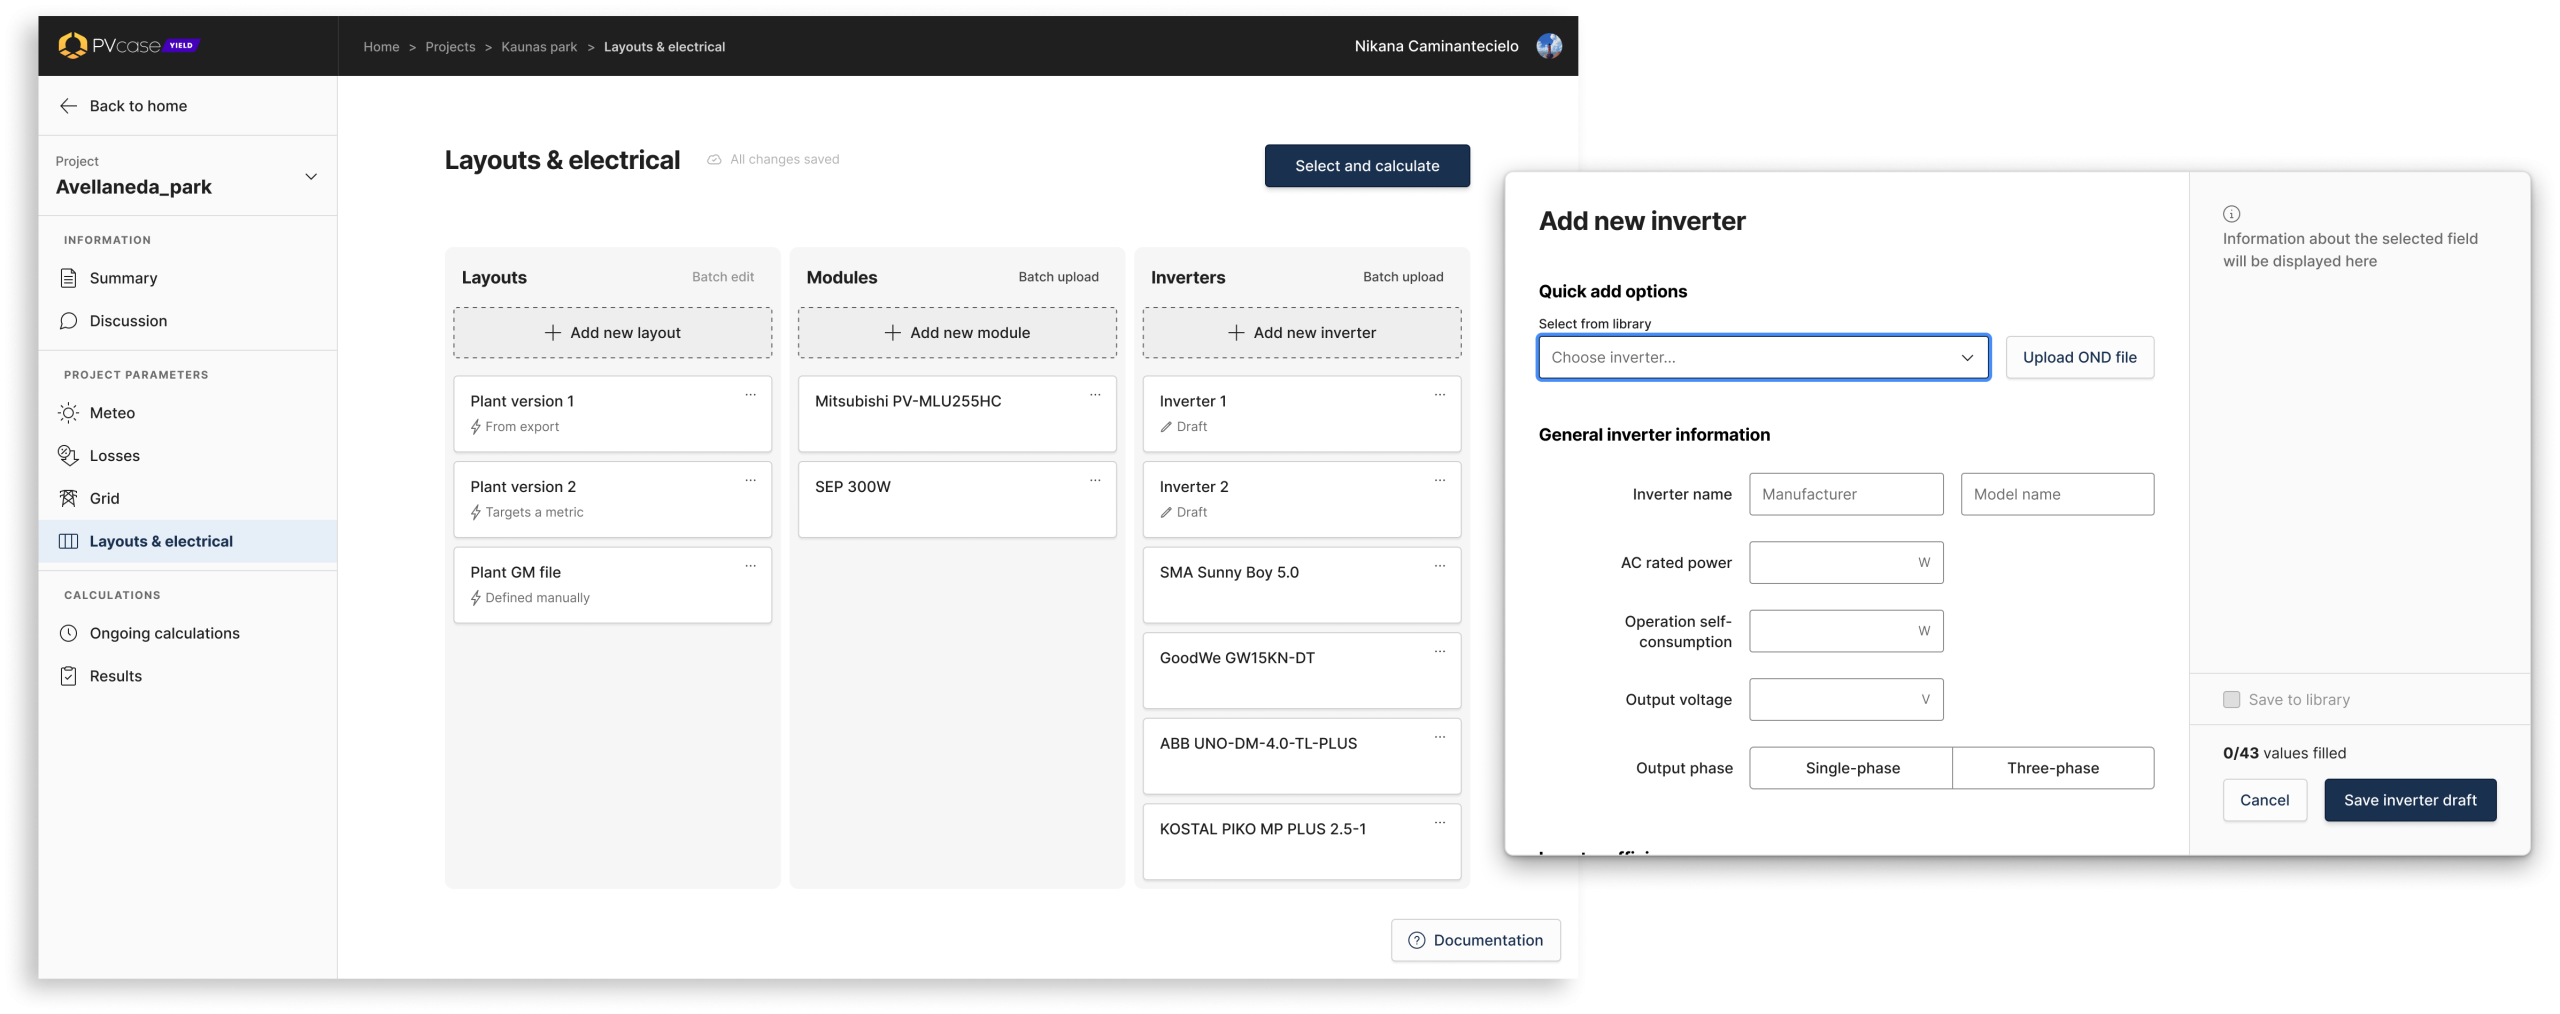
Inverter Temperature Derating — Seven new fields were needed to capture how power output changes with temperature — too many to add as a plain list without losing interpretability. I added a chart, embedded directly in the inverter modal, that updates live as users configure the parameters, matching the conventions of manufacturer datasheets so engineers could orient quickly. It doubles as both a data-entry aid and a sense-check before running a simulation, and the PDF report was updated to reflect the new fields.

Conclusions
Project analysis
Outcome
All three features shipped — probability estimation, inverter temperature derating, and MV/HV separation. Support tickets related to these areas dropped by 68%, and 20% of simulations now include MV/HV transformer modeling, a strong signal of adoption among utility-scale users. Follow-up sessions confirmed the changes matched how users actually think about their plants.
Retrospective
The biggest lesson from this project was that with domain experts, the hard part isn’t simplifying — it’s building interfaces that match how they already think without diluting the underlying complexity. That’s a lens I’d bring in from day one on the next project, rather than letting it emerge through iteration.


